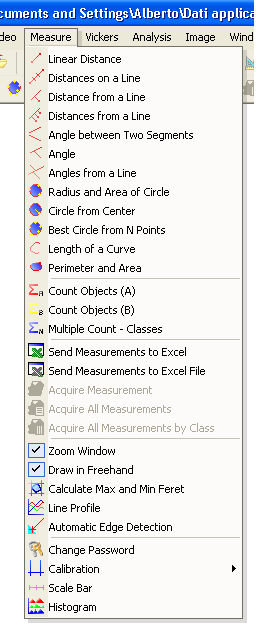
The measurement functions become available if at least an image
has been opened or if the live image
is active with WDM-compatible
acquisition peripherals.
![]() The measurement functions can be used on the live image too.
The measurement functions can be used on the live image too.
The drawing of lines between points happens in real time with all measurement
functions. During and ending measurements the lines assume the "negative"
stroke color. This color indicates the group of lines or objects
currently selected and by using the shortcut menu
their properties can be modified.
![]() The default line properties such as font, stroke color, style
and thickness are selected from the Tools
menu.
The default line properties such as font, stroke color, style
and thickness are selected from the Tools
menu.
Zoom Window
If the Zoom Window switch is active, the zoom dialog is displayed during measurement. In the zoom dialog you can select a zoom factor between 1x and 8x. Normally, the selected factor is 3x. To modify the zoom factor click the right mouse button when the mouse pointer is inside the zoom dialog and make the selection.
Capture an existing point
If you need to perform a measurement using
one or more points previously selected,
for example, if you want to measure an interaxis, hold down the <Ctrl>
key and click the left mouse button in the vicinity of the point. The
program will capture the nearest point.
![]() Each
point is identified by a little cross on the image.
Each
point is identified by a little cross on the image.
After performing the first measurement and if a measuring function is still active, by clicking the right mouse button on any point of the image, you will open the shortcut menu having the following functions:
![]() By object we indicate a set of lines in a measurement or
text.
By object we indicate a set of lines in a measurement or
text.
delete
removes but does not destroy the object;
Undelete
undoes the previous operation restoring the object;
SELEct Object
allows you to select an object to modify its properties;
move text
allows you to move text for a measurement or comment;
select and move vertex
each point of a measurement or vertex can be moved: indicate with the mouse the point to be moved and click the left mouse button. Then point to the new position and click again the left mouse button. The system will update the measurement in the new position;
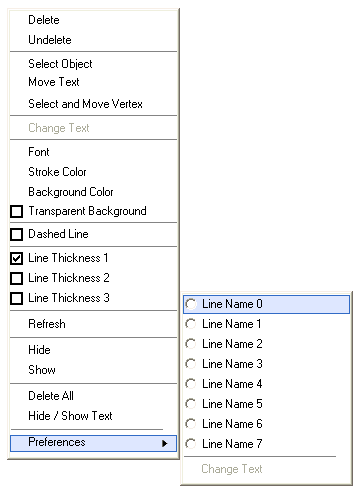
change text
opens the text
box;

font
opens the dialog for selecting the text font in a measurement;
stroke COLOR
opens the dialog for selecting the stroke color;
background COLOR
opens the dialog for selecting the text background color in a measurement;
TRASPARENT background
switch to make the text background transparent in a measurement;
dashed line
switch for dashed line style (thin line only);
line thickness 1
thin line: 1 pixel;
line thickness 2
medium line: 2 pixels;
line thickness 3
thick line: 3 pixels;
refresh
redraws all the graphics;
hide
hides all the graphics. the subsequent measurements will be visible;
show
displays again all the previously hidden graphics;
delete all
removes all the performed measurements;
hide/show text
keeps the graphics but hides or shows the values in a measurement;
preferences
associates the properties of a line to a custom name.
select the position;
edit the text name;
define the properties of the line: font, stroke color, thickness and style.
repeat the procedure for another position.
if you change the current position, the previously associated settings will be enabled.
 LINEAR distance
Click the left mouse button on the two points between which you wish to measure the linear distance. The measurement can also be performed on magnified or reduced images.
The right mouse button allows you to delete the last measurement (shortcut menu).
![]() The
image's title bar
contains:
The
image's title bar
contains:
the current zoom factor (e.g., 1x);
current objective (calibration) at the moment of acquisition from videocamera;
the address and the name of the image;
the number related to the image from 001 to 499.
Click the left mouse button on the two points identifying the extremities of the line. Click the left mouse button on the points between which you wish to measure the distances. The distances on the line must be measured from the first extremity of the line to the second. The right mouse button ends the procedure. If you go past the second extremity of the line, this will be taken as the last point and as the term of operation. If some of the intermediate measurements are unnecessary you can select and delete them.
Click the left mouse button on the two points identifying the base line.
Click the left mouse button on the point of which you wish to measure
the distance from the base line. The program also draws the line parallel
to the base line. The lines parallel
to the base line with known distances can be drawn: press the <Enter>
key, insert the distance and confirm.
![]() This function is useful for
measuring thickness since the measurement takes place perpendicularly
to the border indicated by the base line.
This function is useful for
measuring thickness since the measurement takes place perpendicularly
to the border indicated by the base line.
Click the left mouse button on the two points identifying the base line. Click the left mouse button on the points of which you wish to know the distances from the base line. The right mouse button ends the procedure.
Click the left mouse button on the two points identifying the first
segment; click on the other two points of the other segment. The values
of the interior angle and its complement will be displayed. Angles are
measured in degrees with decimals in thousandths of degree.
![]() To measure an angle the vertex is not required in the visual
field.
To measure an angle the vertex is not required in the visual
field.
Click the left mouse button on the three points identifying the angle; the second point is the vertex. The values of the interior angle and its complement will be displayed. Angles are measured in degrees with decimals in thousandths of degree.
Click the left mouse button on the two points identifying the base line. Click the left mouse button on the pairs of points identifying the other segments of which you wish to know the angle with the base line. The values of the interior angles and their complements will be displayed. Angles are measured in degrees with decimals in thousandths of degree. The right mouse button ends the procedure.
Click the left mouse button on three points belonging to the circumference. The radius, the area and the center of the circle will be displayed. Concentric circles with known radius can be drawn: press the <Enter> key, insert the length and confirm.
![]() The
center of the circle can be used for interaxis measurements.
The
center of the circle can be used for interaxis measurements.
Click the left mouse button on the center and on a point of the circumference.
The radius, the area and the center of the circle will be displayed. Concentric circles with known radius
can be drawn: press the <Enter> key, insert the length and confirm.
![]() The center of the circle can
be used for interaxis measurements. Also, three points on the circumference
are created, each making a 45-degree angle with a virtual horizontal line
passing through the center.
The center of the circle can
be used for interaxis measurements. Also, three points on the circumference
are created, each making a 45-degree angle with a virtual horizontal line
passing through the center.
Click the left mouse button on the starting point of a curve. If the Draw in Freehand switch is not selected, move the mouse pointer along the curve and left-click on the next point. A straight line will be drawn with the previous point. Continue in the same way to draw the curve as a polygon. During this process, clicking the right mouse button will delete the last line (side) drawn. When you reach the final point of the curve, double-click the left mouse button. The length will be displayed. If you wish to draw the line as continuous, select the Draw in Freehand switch, click the left mouse button on the starting point of the curve and click the right mouse button or double-click the left mouse button on the final point of the curve. The length of the curve will be displayed.
Click the left mouse button on the starting point of a perimeter. The same procedure as for the Length of a Curve above applies. If the Draw in Freehand switch is selected, the perimeter will be drawn as a continuous line, otherwise as a polygon. Move the mouse pointer along the perimeter. When you reach the final point of the perimeter, double click the left mouse button. After a few instants the perimeter and the area of the figure will be displayed.
These are two counters enabling you to count the objects in the active window (left mouse button). The right mouse button deletes the last calculation.
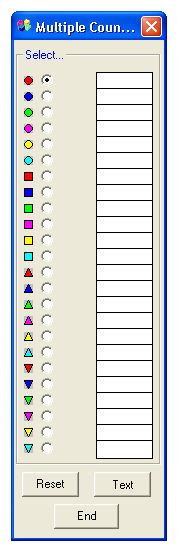 Multiple Count
24 channels are available with an equal number of graphic symbols. It is possible to associate a name with each channel. The counters' values can be sent to an Excel spreadsheet.
Classes
By keeping the multiple count dialog open, the measurements can be associated with different classes when the current channel changes. The measurements, divided into classes, can be sent to an Excel spreadsheet.
Allows you to activate the dynamic link to Excel. It displays automatically an empty spreadsheet. When you export the measurement the first time the column name will be created and each column will receive data.
Click the button to minimize the Excel environment into an icon so as to hide the spreadsheet.
acquire or load the image on which to perform the measurements;
perform the measurement;
click the Acquire
Measurement ![]() icon
to send to Excel.
icon
to send to Excel.
The Test Number counter will show an increase and the measurement
will be sent to the Excel spreadsheet.
To verify, minimize the X-Pro environment into an icon and reopen the Excel
environment.
Acquires the last measurement to send to Excel.
Sends all the measurements present on the active image to Excel. Each measurement will be placed in the relevant column.
If the multiple count dialog is open and a measurement function is selected then the sending to Excel will take place by class. Each column will receive the measurements of its own class.
When active during measurement, it opens the zoom window displaying the area around the position of the mouse pointer on the image. The zoom factor is 3x (default) but is selectable between 1x and 8x. To modify the zoom factor click the right mouse button when the mouse pointer is inside the zoom window and make the selection.
Allows you to choose the line as continuous instead of polygonal for the following functions: Length of A CURVe and PERIMETeR anD AREA in the Measure menu, and define rEGIONs in the Digital Camera menu and the Analysis menu.
Allows you to view the values of the two Feret diameters with the PERIMETeR anD AREA
function.
![]() The two Feret diameters are the maximum and minimum lengths
of the projections obtained by the figure's 360° rotation.
The two Feret diameters are the maximum and minimum lengths
of the projections obtained by the figure's 360° rotation.
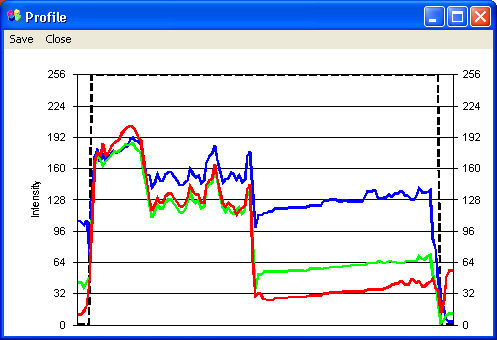
If active during the LINEAR distance measurement, it opens a sizeable window displaying the profile in the three RGB color components of the line joining the two chosen points. The profile can be saved.
If active during the LINEAR distance measurement, it allows you to perform the objective measurement of a profile. The program chooses the two measurement points in the area of maximum gradient within the cursor, between the center and the edge in the direction of measurement.
The point of maximum gradient is searched for in the area inside the cursor in the direction of measurement.
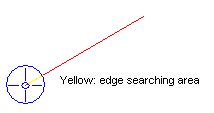
The two points chosen for the measurement can be seen in the line
profile.
They correspond to the steepest increase and decrease in the y-axis (maximum
positive and negative gradients) of the black dashed line.
Administrator's Password for the Protection of Calibrations
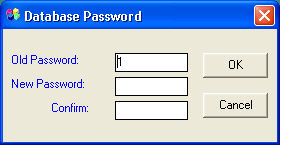
If the password is disabled, anybody can change the system's calibrations.
If a new password is entered, from then on that password will be necessary
to access the calibration functions.
If you do not wish to use a password any longer, it is possible to disable
it by selecting the character 1 as the new password.
Allows you to perform the calibration for the Current Objective.
It is possible to insert a scale bar in any area of the image. Its size
can be automatic or manual by entering the desired value with the keyboard.
Then point to the position on the image and click the left mouse button.
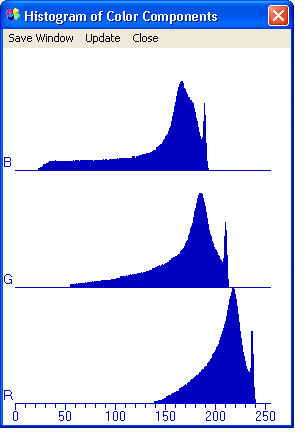
Displays the histogram in the three RGB color components for the active image.